Summary
Fine particulate matter in the air from cars and trucks, cooking, fires, and industry can give you cancer, heart attacks, and shorten your lifespan. Poor air quality can have a number of other bad effects. You can make a DIY air quality monitor (AQM) for about $20 that can warn you of poor air quality. You can add internet datalogging for another few bucks. This will give you a rough measurement of the air quality of your environment, and can help you determine if you should do anything about it (get an air filter, etc).
Background
Tiny particles in the air, generated from cars, trucks, powerplants, industry, and even cooking and burning fires at home, are causing cancer, heart attacks, and premature death among other ailments.
The risk of getting lung and brochus cancer stand at around 7% today, though around 80-90% of this is thought to be due to smoking.
Particulate pollution may be getting worse as our population grows and demands more transportation and energy (I don’t have any numbers to on this currently, perhaps it is actually getting better from cleaner engines and powerplants). Particularly dangerous are the tiny particulates less than 10 microns in size, especially those less than 2.5 microns in diameter (PM2.5). These are about 100 times smaller than the width of a human hair, and can pass directly into the bloodstream, increasing risks for diseases like cancer and heart disease, among other things. An increase in concentration of PM2.5 by 10 ug/m3 (micrograms per meter cubed) equates to a 36% increase in lung cancer! Coincidentally, the national average of PM2.5 in the US is about this value. China, with their horrible pollution (air and otherwise), has been witnessing cancer becoming an epidemic. And if you live near a major roadway, you’ve got a slew of tiny particles bombarding you, shortening your life and decreasing your quality of life.
The scary thing is, the exhaust from combustion engines (cars, trucks, lawnmowers, weedwhackers, farm and industry equipment) actually spews a TON of very tiny particles that are very difficult and expensive to detect. Here’s a plot from a scientific paper, showing a distribution of exhaust from a diesel engine:
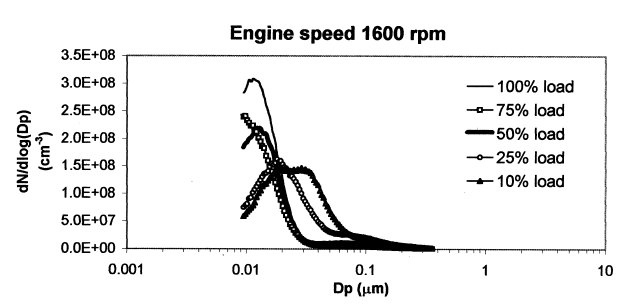
Most of the particles are in the range of 0.01 to 0.1 micron! That’s so tiny it can actually penetrate your skin. Whoa!

In the summer/fall of 2014, I started having sinus headaches and other sinus/mucuous issues. At the time I thought my air quality might have something to do with it (it was actually mostly from chemical air pollution in a solar cell factory I worked in), so I started researching how to measure it. Turns out the cheapest devices are cost around $200+ (the nifty Speck sensor, the Dylos sensor that was available at the time, and the Aircasting device).
After some google-y googling, I found this post, which described how to set up a DIY particulate monitor based on the Shinyei PPD42NS sensor. It measures the number of particles greater than 1 micron in diameter in 0.01 cubic foot, the same number measured by the $200+ Dylos laser-counting machine. Great, we have a number. In the words of Lord Kelvin:
“I often say that when you can measure what you are speaking about, and express it in numbers, you know something about it; but when you cannot measure it, when you cannot express it in numbers, your knowledge is of a meagre and unsatisfactory kind; it may be the beginning of knowledge, but you have scarcely, in your thoughts, advanced to the stage of science, whatever the matter may be.”
So at least we’re not meagre anymore. But what does that number mean? Dylos has a scale on their devices which gives regimes of air quality, but it seems to be to be overly strict. The EPA/NAAQS has also put up a list of air quality regimes, though of course they are grossly inadequate. By the time you’ve passed from ‘good’ to ‘moderate’ air quality by their standards (at 12 ug/m3 PM2.5), you’ve already increased your risk of lung cancer by about 40%! Baseline cancer risk was about 0.05% in 2012, and about 7% in your lifetime. I think they may have picked a number that would be reasonable for most US cities to attain as their threshold for a law (the 12 ug/m3), since the national average is somewhere around 10 ug/m3 PM2.5.
So the number in the cancer study and widely used for regulation is ug/m3 (micrograms per cubic meter), but the device we’re going to build measures number of particles greater than 1 micron in size. How can we reconcile this? Thankfully, Alex Besser with Aircasting created a correlation between mass and particle counts, using cooking smoke as a basis (it’s a 4th-degree polynomial, on page 24).
Here is a plot of % increase of lung cancer odds with the EPA standards:
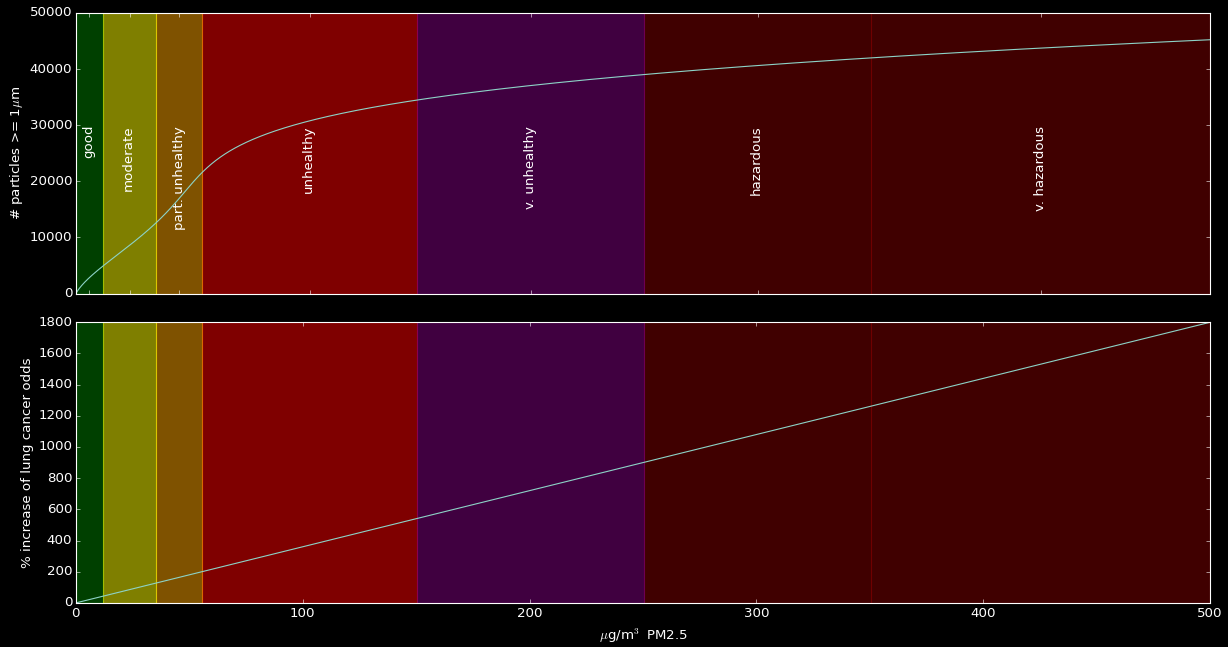
the line on the top plot is the number of particles per 0.01 ft3. By the time you’ve crossed the threshold from ‘good’ to ‘moderate’, your chances of lung cancer have increased by 43%. The next few thresholds hit 128%, 200%, and 542%. Your baseline odds of lung cancer (non-smoker) are only around 1.5%, so a 200% increase means you have a 4.5% chance of getting lung cancer. Of course, this relationship shouldn’t exacly be linear–it should asymptote at some point.
At the mid-level ‘hazardous’ cutoff (above which I’ve labeled ‘very hazardous’, but the EPA still labels ‘hazardous’), your chances of getting lung cancer are about %15 (assuming the linear relationship between particulate matter and lung cancer holds).
Now here are the Dylos standards:
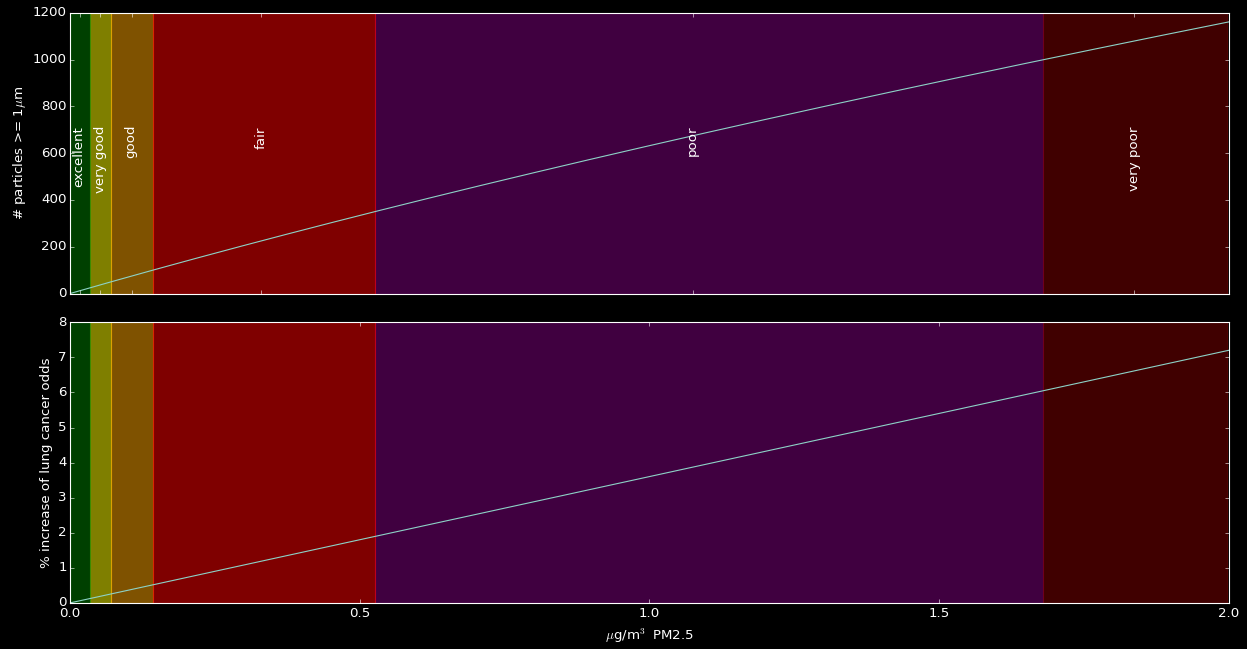
You’ll notice the Dylos standards are on a completely different order of magnitude from the EPA. They Dylos ‘very poor’ regime starts at around 1.7 ug/m3 PM2.5, while the EPA moderate starts at 12! The EPA ‘very poor’ equivalent, which I would say is ‘very unhealthy’, starts at 150 ug/m3, which is an astounding 100x the Dylos standards. Having been in an environment with >=1um particle counts of 5000 to 15000 (metalworking workshop at Factor-e-Farms a.k.a. open source ecology) where my nasal mucus was turned black, and a kitchen with burning bacon grease and a count of 25,000 particles, I would say quadrupling the Dylos scale is probably legit. When the number of 1um particle counts get above 1000, I definately notice it in my breathing–my nose starts getting stuffed up. At the 25,000 1um-and-larger particle counts (66 ug/m3 PM2.5, on the lower side of ‘unhealthy’ on the EPA scale) which I experienced in the kitchen with burning bacon grease, the whole house was filled with smoke and the view over a few meters was hazy.
While I was in the Bay Area, I usually measured values of 1000 to 4000 1 um-or-larger particles in 0.01 ft3, corresponding to about 2 to 12 ug/m3 PM2.5. Recently in Boulder/Golden, CO, I consistently measured values 2000-2500 1 um-or-larger particles per 0.01ft3, about 3 to 5 ug/m3 PM2.5. So while the numbers aren’t too terrible, the increased chances of getting lung cancer from breathing that type of air regurlary is in the double digits. Near my parents’ house in Elkhorn, NE, the air quality is usually about 200 1 um-or-larger particles per 0.01ft3, or about 0.3 ug/m3 PM2.5.
Inside your house, you’re shedding millions of skin cells per minute all the time, and walking around generates a bunch of dust in other ways–like making allergens from dust mites (feeding on your dead skin cells) go airborne. Wikipedia has more good info on particulates. Now I’ll show you how you can build your own sensor, which will tell you real time numbers–watch as the value goes up when you fry things, or even walk around!
Parts
To do this, you will need:
- arduino (I used a nano)
- LCD display (I used a 1602 16x2 HD44780 Character LCD /w IIC/I2C Serial Interface Adapter Module, labeled FC-113)
- Shinyei PPD42NS device
- Some female-female jumper cables
- USB power adapter if you want to plug it into the wall
Setup
First, get your LCD working. There’s a few guides ([1], [2], [3]) I found out there to help, but first, solder on the I2C adapter to the LCD in the correct fashion:
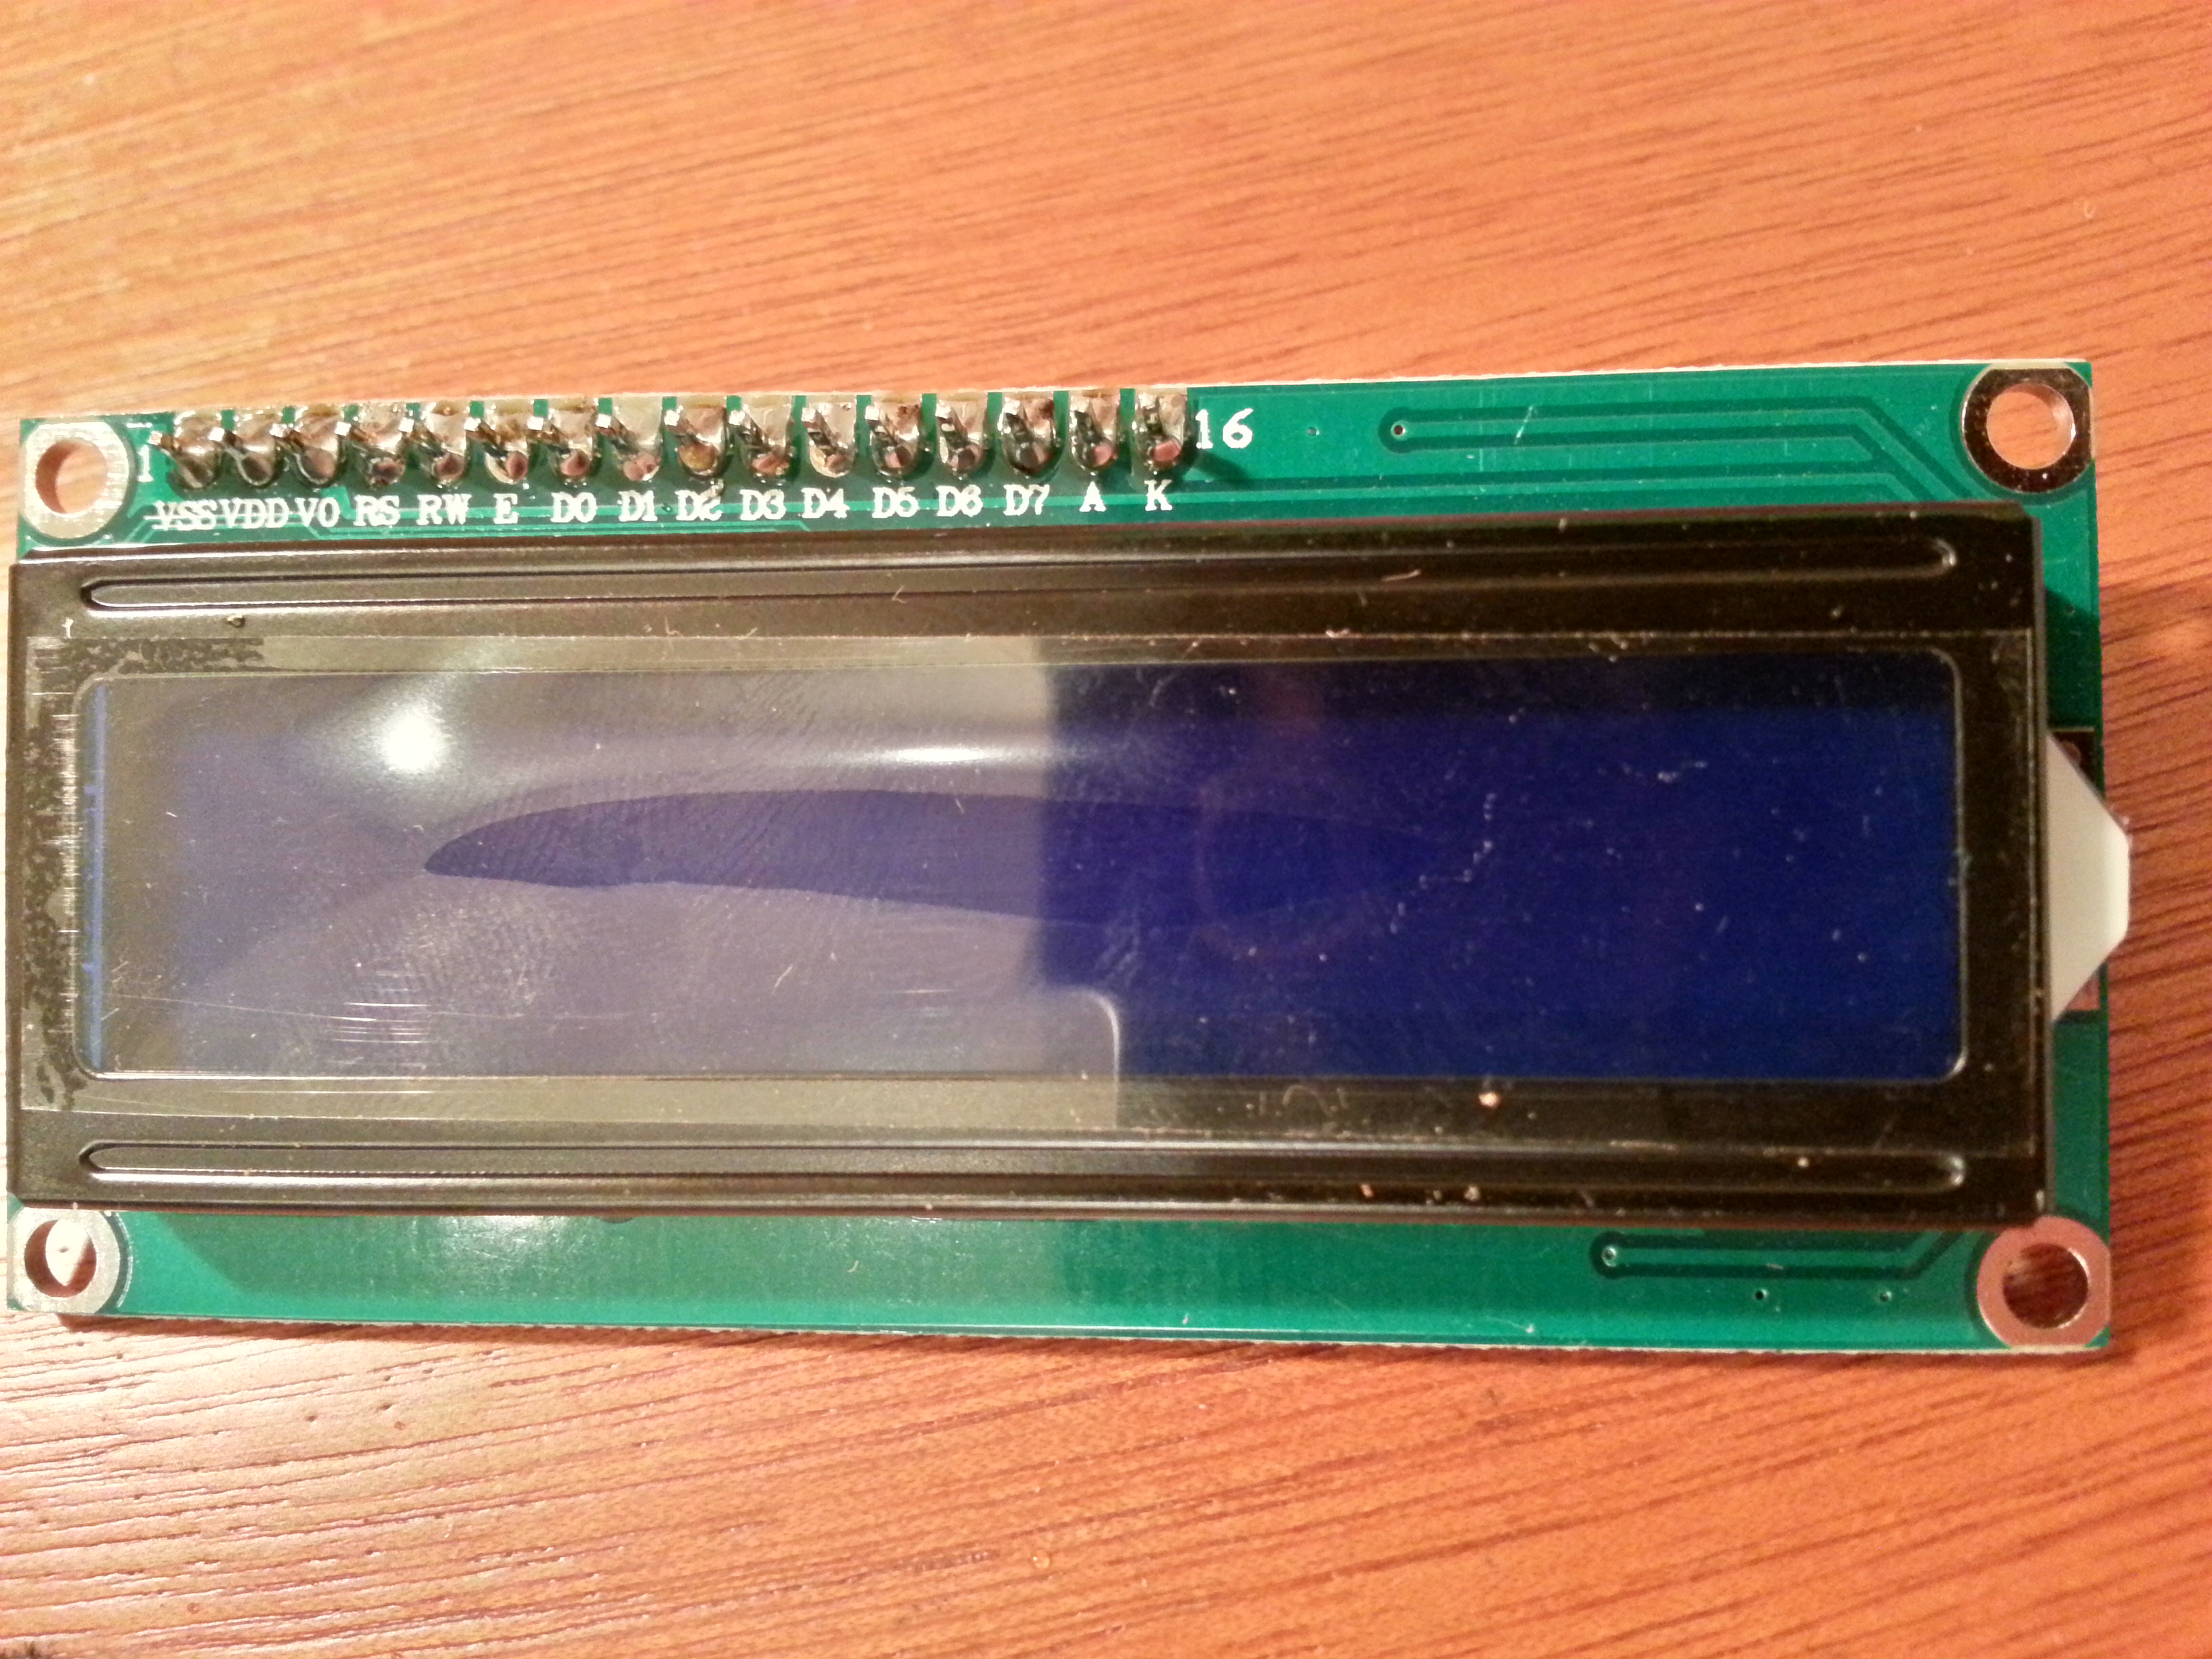
Next make sure you can get the display up and working. The example websites I found describe a way to do it using an older version of the LiquidCrystal library (1.2.1), which will work. It also seems to work with the latest version (1.3.2). To install, download the zip file, unzip into your Arduino libraries folder (for me it was C:\Users\Nate\Documents\Arduino\libraries), then rename it to ‘LiquidCrystal’. Make sure to close your Arduino IDE program if open, and restart it to refresh the directory cache. I used the example given from mklec.com, with small modifications:
/**
 * I2C/IIC LCD Serial Adapter Module Example
 *
 * Instructions at http://blog.mklec.com/how-to-use-iici2c-serial-interface-module-for-1602-lcd-display
 *
 * This uses the Liquid Crystal library from https://bitbucket.org/fmalpartida/new-liquidcrystal/downloads GNU General Public License, version 3 (GPL-3.0)
 * Pin Connections:
 *      SCL = A5
 *      SDA = A4
 *      VCC = pin 12 // barely can supply enough current for the LCD (20mA required, and is max output of digital pins)
 *      GND = GND
 */
#include <Wire.h>
#include <LCD.h>
#include <LiquidCrystal_I2C.h>

LiquidCrystal_I2C	lcd(0x27,2,1,0,4,5,6,7); // 0x27 is the I2C bus address for an unmodified module

void setup()
{
    pinMode(12, OUTPUT);
    digitalWrite(12, HIGH);
    lcd.setBacklightPin(3,POSITIVE);
    lcd.setBacklight(LOW); // NOTE: You can turn the backlight off by setting it to LOW instead of HIGH
    lcd.begin(16, 2);
    lcd.clear();
}

void loop()
{
    lcd.setCursor(0,0);
    lcd.print("whatever");
    lcd.setCursor(0,1);
    lcd.print("hello world");
    delay(2000);
    lcd.clear();
    lcd.setCursor(0,0);
    lcd.print("doo doo");
    delay(2000);
}
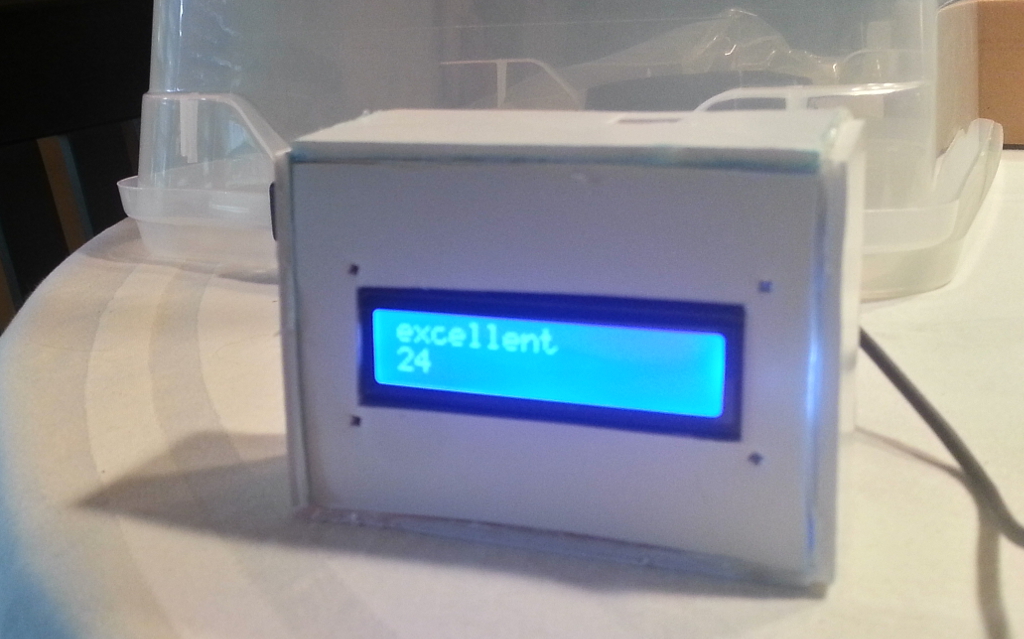
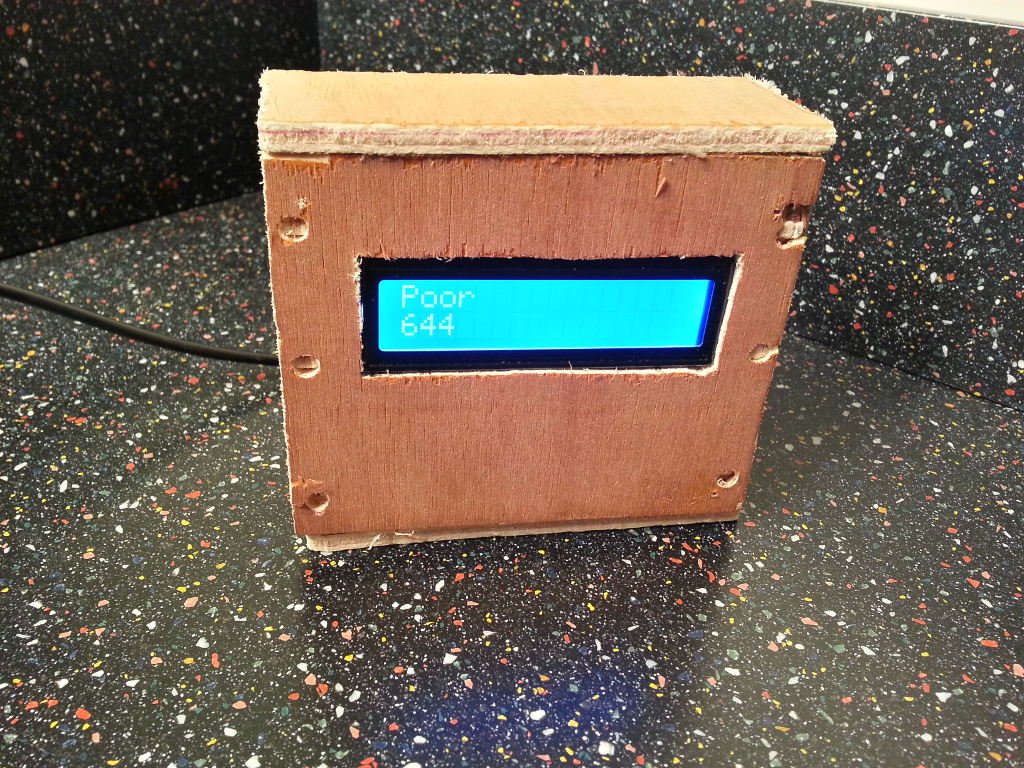
Once you have that working, construct the container for the sensor. We need to be able to hold the particle senser upright since it uses a resistor to create a hot-air draft for an air flow. I’ve found it easy to quickly prototype custom cases by cutting out foamboard and hotglueing it, a second case I’ve made was cut with a jigsaw from 1/4” thick wood. I’m currently working on a laser-cut case for it.
Finally, connect the Shinyei PPD42NS sensor, and upload mah code from github.
This will measure the number of particles >1 micron in 0.01 cubic feet, and update the reported value on the screen every 5s. On the first line, it will translate that value into a meaninful description, like horrible, good, excellent, etc.
Here’s a pic of the finished product (blurry, doh!), which I have since ripped apart:
and the one made out of wood (actually has a NodeMCU devkit inside):
Next, add datalogging. Here are the options I have for doing this right now:
- connect the device to a computer via usb, and use a Python script to upload the data to sparkfun or thingspeak. Here’s some demo code for posting to sparkfun from a Shinyei PPD42NS and a Dylos sensor
- connect the arduino to an esp8266, nrf24, or particle spark, and upload the data online. Here’s some demo code for a esp8266 running NodeMCU. You can also use the AT commands (which I don’t really like), example here.
Details
To make sure the digital pins could supply enough juice to the LCD, I went ahead and measured the current. It turned out to be just under 20mA, which is the maximum recommended constant current output from the digital pins, huzzah! If this weren’t the case, we’d have to expend a little extra effort to split the 5V power from the board, since on the UNOs and nanos I have, only one 5V pin exists.
The Shinyei PPD42NS is connected to the 5V pin directly, since it can take up to 90mA (but only takes 70mA on the one I measured).
