Summary
I scraped all of leafly.com’s reviews, as well as 20,000 chemistry measurements of cannabis products. I used the reviews to make a collaborative recommendation engine, as well as a similar-strain recommender (still in progress). While studying the reviews and chemistry, I found that the reviews and chemistry data tend to group best into 3 groups. Two of the groups are similar, but one is a high-CBD group that is talked about a lot for pain and anxiety.
The app was live at cannadvise.me, but I took it down so I wouldn’t have to fund it. However, there’s a video overview here, and the GitHub code is here.
Motivation
The idea for a cannabis recommender came when I started looking at leafly.com. They have so many reviews and strains to look at, it’s overwhelming. In fact, they have over 2000 strains/products (a few edibles and vape pens) listed in their ‘strains’ section. I also saw a talk by a woman on cannabis big data, saying how a recommender system would be really nice for dispensaries, since they have rotating menus. The recommender would suggest similar strains to people depending on what they ask for.
Cannabis business growth
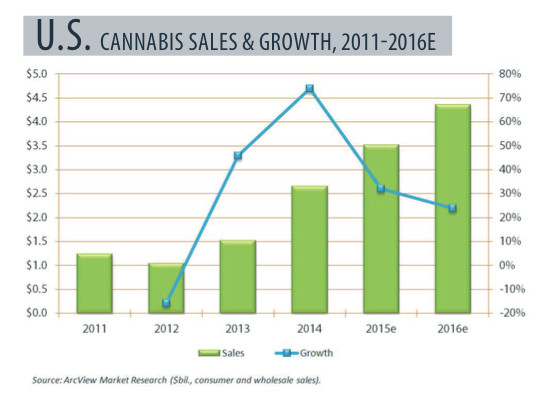
The legal cannabis business has grown in leaps and bounds lately. Especially since legalization of retail (“recreational”) stores in CO, and less-restricted use in other states, sales have been exploding, and are expected to further as more states legalize all facets of sales and consumption.
Global prescription pills market
Probably the biggest potential for cannabis is not on the “recreational” side of things, but rather treating chronic medical ailments that people currently treat with pills. The top 4 markets I’ve identified are listed below, and total to about $60B in annual worldwide sales.
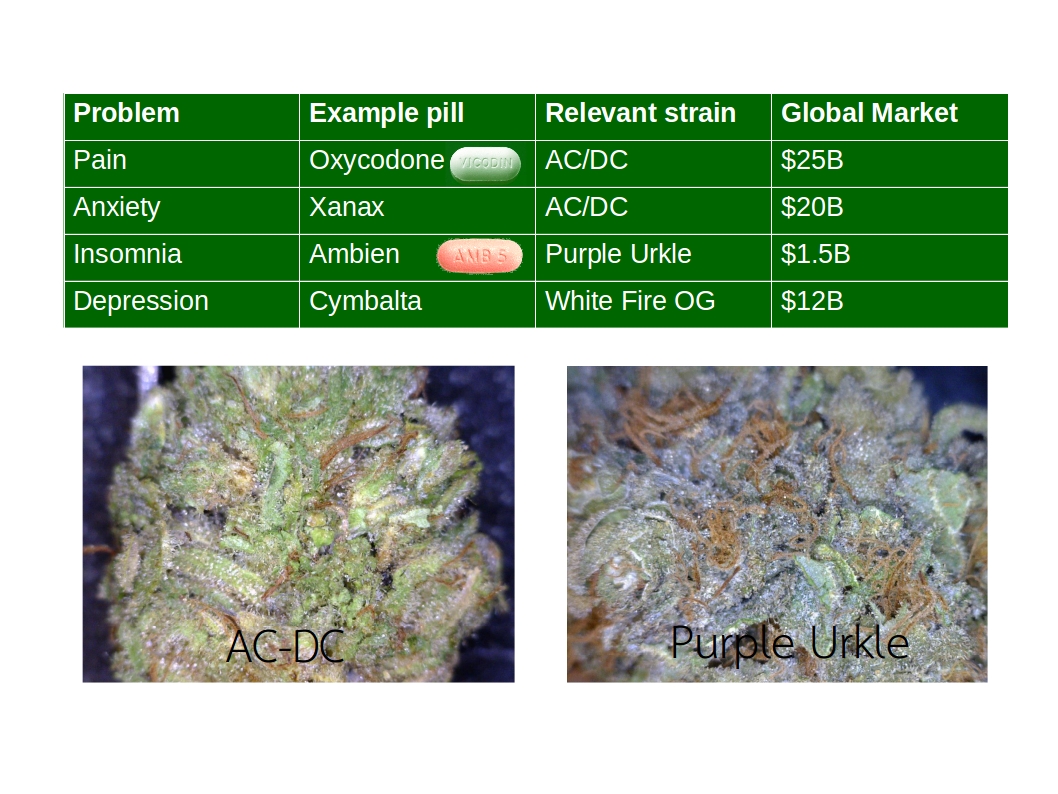
I found relevant strains by using the leafly.com reviews to look for terms related to the conditions the prescription pills treat–for example, for “pain” I found the strain with the highest tf-idf value for “pain”. It turns out that AC/DC is the most mentioned strain for these conditions. This particular phenotype has very low THC (often less than 1%), and high CBD usually over 10% by weight.
Some of the reviews on ACDC said:
“…my go to for pain relief.”
“…didn’t get me high…had a migraine…within 2 hours it was 99% gone. Plus I felt relaxed and pleasant.”
THC vs CBD
THC (tetrahydrocannabinol) and CBD (cannabidiol) actually share the same number and type of atoms. In fact, they only differ by one chemical bond. However, their psychoactive effects differ greatly. THC is known to get people ‘high’; in other words, inebriate them, and bring about a state of euphoria. Negative side effects can result from too much consumption (short- and long-term). It can also have a variety of effects depending on the person and dosage – typically it increases hunger, sleepiness, and sometimes paranoia. CBD, on the other hand, has been known to reduce anxiety and pain. CBD is also thought to reduce the negative effects of THC like paranoia and fuzzy-headedness.

Scraping
If you need to scrape a site that uses javascript to dynamically load content, I found one way to do it is using selenium in conjunction with the phantomJS driver. For example, on leafly.com, the page with the strain listings has a button on the bottom to ‘load more’. You have to keep clicking that button (100s of times) to get to the bottom of the page and get all strains. You also have to click through a popup asking if you’re 21 or over. The file that scrapes leafly is over 1000 lines long, but here’s a few of those functions I just described:
from selenium import webdriver
from selenium.webdriver.common.desired_capabilities import DesiredCapabilities

def setup_driver():
    dcap = dict(DesiredCapabilities.PHANTOMJS)
    dcap["phantomjs.page.settings.userAgent"] = (
        "Mozilla/5.0 (X11; Linux x86_64) AppleWebKit/53 "
        "(KHTML, like Gecko) Chrome/15.0.85"
    )
    driver = webdriver.PhantomJS(desired_capabilities=dcap)
    driver.set_window_size(1920, 1080)
    return driver


def clear_prompts(driver):
    '''
    clears 'are you 21+?' and 'signup for newsletter' prompts
    clicks the buttons so they go away
    make sure to save and use the cookies from the driver after this
    '''
    driver.get(STRAIN_URL)
    age_screen = True
    age_count = 0
    signup = True
    signup_count = 0
    for i in range(3):
        if age_screen:
            try:
                driver.find_element_by_xpath(
                    '//a[@ng-click="answer(true)"]').click()
                print 'clicked 21+ button'
                age_screen == False
            except:
                pass

        if signup:
            try:
                driver.find_element_by_xpath(
                    '//a[@ng-click="ecm.cancel()"]').click()
                print 'clicked dont subscribe button'
                signup == False
            except:
                pass

    # for storing cookies after clicking verification buttons
    cookies = driver.get_cookies()
    cooks = {}
    for c in cookies:
        cooks[c['name']] = c['value']  # map it to be usable for requests

    return cooks
The cookies can then be passed to anything doing a request, and the popups should be taken care of. I found the xpath for the buttons using Chrome’s dev tools (ctrl+shift+i), it’s a really easy way to find an element quickly (if using selenium to find something).
Trends in reviews
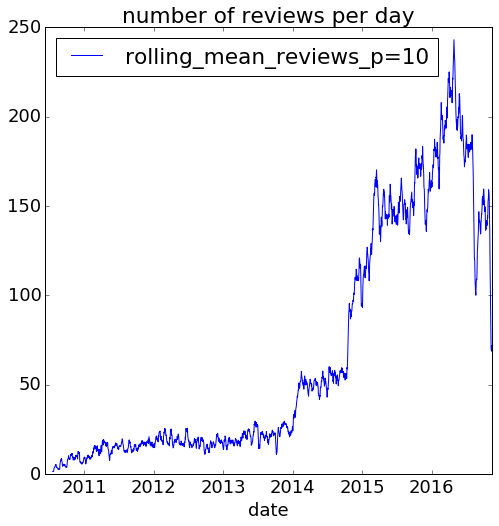
Since recreational legalization in multiple states a few years ago (retail stores opened in 2014 in Colorado), reviews on leafly have increased dramatically. The following plots are rolling means of number of reviews with a period of 10 days.
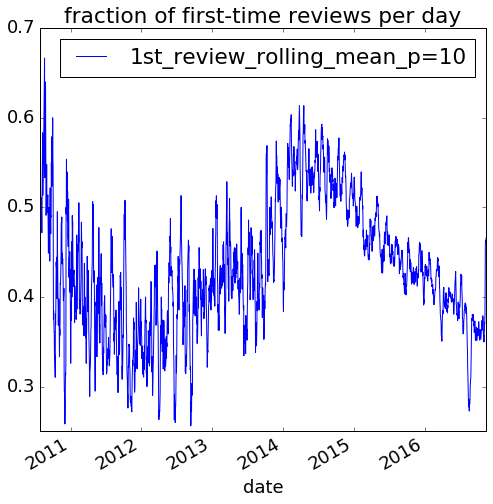
We can also see the number of first-time reviews as a proportion of total number of reviews has been a bit of a roller-coaster:
Soon I’ll plot the reviews over time for certain strains, and some other EDA on the reviews data.
Clustering the strains
I used k-means clustering to group the reviews. Based on the silhoutte score, I found 3 groups to be best for tf-idf of the reviews and of the chemistry data. I used PCA to reduce dimensionality and enhance visualization of the data. Here is the clustering by tf-idf of the full reviews:
I found group 0 to be focused on sleep and relaxation, group 1 focused more towards euphoria and uplifing effects, and group 2 was cbd, pain, and anxiety. Group 2 was only about 5% of the total dataset of different phenotypes (strains).
I also clustered the data by chemistry, and found again 3 groups is best.
The group with low amounts of THC is the same small group above that was focused on cbd, pain, and anxiety. This is a high-CBD group, with strains like ACDC and Harlequin. Note: I accidentally deleted the plotly plot when cleaning up my public plots, so this plot is a similar but slightly different one.
Recommender
I used the reviews to make a collaborative recommender engine with GraphLab. This technique allows you to choose a number of ‘latent features’, and decompose a matrix of [users x products] into two matrices of dimensions [users x latent features] and [latent features x products]. I scored the model based on RMSE, and only used users with more than 2 reviews (for now). I found 10 groups to work best, based on RMSE flattening out after 10 latent feature groups. To get bag-of-words recommendations right now, it compares the words you choose (your bag) to the average tf-idf of each latent feature product group, and picks some of the top-most reviewed strains from that group. It’s not the best way to do it, but it works and is unique.
This method was designed, however, to provide personalized recommendations to a user. So I added that feature: you can enter a leafly username on one page of the site, and it will give you their ranked products they should try next, based on the factorization recommender.
Neural net regressor
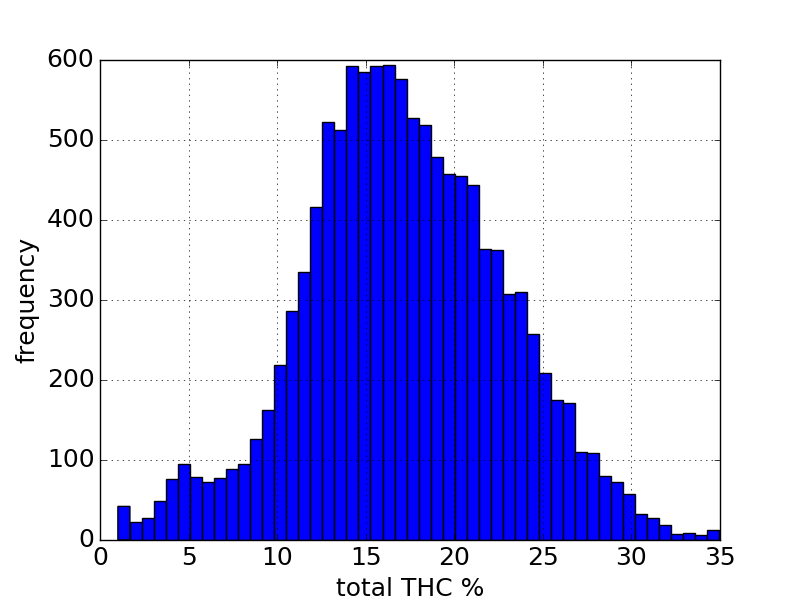
I also tried using a neural net (VGG-19 in Keras) to extract features from ~10,000 close-up images of cannabis flowers. I then used a support vector regressor and boosted tree regressor to fit the features to the total cannabinoid percent. Unfortunately, the R^2 was right around 0 – in other words, just guess the mean level of cannabinoids. We can see there’s quite a bell-curve of THC concentration for the data I have access to, which I think explains this. I think to make this work better, some intermediate layers of the neural net would have to be re-trained to capture unique features to this domain.
Out of time
Unfortunately, I’m out of time to properly finish up this blog post, so I’ll have to come back to it. Hopefully you’ve seen that not all cannabis products have to get someone ‘high’, and there is a group of a few strains (including ACDC and Harlequin) that are high in CBD, low in THC, and have been shown to decrease pain and anxiety. This is a $50B / year market that could be disrupted by high-CBD products.


